Freshwater Map

Standard & Customized River Maps

We use state-of-the-art technology to map the flow of rivers. Our field team can gather data up to 50 kilometers of river per day. This allows us to gather an immense amount of data for our clients. Once our team has completed their work, we use our proprietary River Analyzer (RA) software to process the data we gathered. Depending on our client’s needs, we then create custom-tailored maps, graphs, datasheets, reports, and documents that they can use to achieve their goals for river stewardship.

What types of river maps can we create?

River Temperature – These maps show temperature levels along hundreds of miles of river and show how those levels change with flow variation.

Flow Variability – These maps show how river flow volume increases and decreases due to the effects of local water tables, stream confluences, agriculture, and other factors.

Habitat Area – We can define and geolocate optimum habitat areas for species that have a defined habitat suitability index.  Habitat is typically defined using multiple variables including depth, flow, and substrate composition.  We generate three separate maps showing (1) flow velocity in meters/second, (2) depth in meters, and (3) a third map which combines these two variables into one single metric that that describes the energetic value of the flow, also known as the Froude number.

Drift Vectors and Velocity –  These maps show the direction and velocity of river currents at different depths. These maps show where objects will drift within the river flow. We can measure from the river bottom for negatively buoyant objects such as sturgeon eggs, or the upper water column for things like spilled oil or depris. 

 How are our maps used?

Fish Habitat and River Restoration Projects – Our data is often used to map the ideal habitat locations for threatened or endangered species. During a recent project, we were tasked with surveying an engineered log jam. The log jam had the purpose of creating ideal fish habitat. We completed our survey and interpolated the data for our clients. They then used that data to monitor the engineered log jam project for efficacy in creating ideal fish habitat. Our surveys can be conducted once and then repeated at different locations or annually to monitor the area over time. This data is extremely important to the success of river restoration projects.
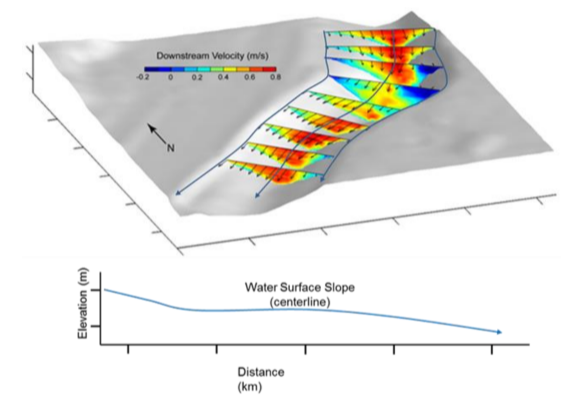
3-D plots of the flow field important to fishery habitat assessment as well as monitoring river restoration projects.

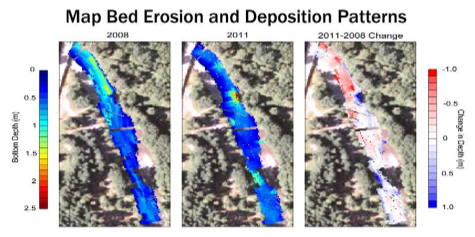
Sediment Erosion and Deposition in Rivers – Our Team can collect data during flood events to show where river bed sediments are moving and where bed scour and deposition is occurring. This is extremely useful in projecting potential river flow changes and erosion. The uses for this type of data are many, including riverside development concerns, determining future flood hazards, and planning river stewardship projects.  

River Stewardship – Our work makes it possible to capture and analyze the hydrodynamics of a river in ways never before possible, thereby enabling river stewards, such as tribal, city, state, and non-profit organizations to make management decisions based on the best data available.

Other Uses – There are many more ways our maps and data can be used, including the creation of maps for recreational river activities like rafting and fishing, analysis of dams and their impact on rivers, and many other applications.
© 2017 Freshwater Map. All Rights Reserved | Custom Web Design and Development by Alex Bonesteel